

Why player load is more than GPS, and what that means for fixture congestion.
When we talk about player load, the conversation usually goes straight to GPS. Total distance. High-speed running. Sprints. Accelerations and decelerations.
All very useful. But are they really load?
I'm increasingly convinced they're only part of it.
Let me explain, as it’s a question that matters more now than it has for a while. In June 2025, UEFA launched a major study across elite men's and women's football aimed at defining what “load” means. The first phase asked clubs, players, coaches and medical staff what they mean by the word. The second will test historical calendar, performance and regulatory data against injury, performance and welfare outcomes.
Now, that is significant. UEFA isn't looking for yet another GPS metric. It's asking the question many of us skip.
We've become pretty good at measuring what the players do. We're maybe not so good at understanding what it costs them.
GPS measures exposure, not cost
GPS has transformed football monitoring, and I use it every week. It tells us, with real precision, what a player did on the pitch.
What it doesn't know is that the player also played 90 minutes three days ago. Or got home from an away game at 3am. Or has started six matches in a row. Or slept badly for a week.
It measures the work. It doesn't measure how the player is coping with it.
The research reflects this. GPS metrics are useful for describing physical exposure and some aspects of short-term fatigue. Hader et al. (2019) found that high-speed running was linked to muscle damage markers and drops in jump performance, particularly in the first 24 hours after a match. Total distance showed no clear link with fatigue at all.
But systematic reviews haven't shown us that GPS metrics can reliably predict injury (Kupperman & Hertel, 2020; Jiang et al., 2022).
Monitoring fatigue and predicting injury are two very different jobs. Treating them as one is where monitoring goes wrong.
What fixture congestion actually does
I have found that the link between congestion and injury is one of the stronger parts of this evidence base.
Page et al. (2023) reviewed the research in professional men's football. Five of the eight studies found higher match injury rates during congested periods.
UEFA's own injury surveillance points the same way. Bengtsson et al. (2013) found higher muscle injury rates in league matches played with four days or fewer recovery, compared with six days or more. A later study of more than 130,000 match observations found muscle injury rates were lower when players had at least six days between matches (Bengtsson et al., 2018).
That sounds compelling. It needs context.
Total injury rates don't consistently rise. Studies define “congestion” differently. And almost all of this evidence is observational.
So I wouldn't say fixture congestion causes injuries. The defensible version is something more like: repeated short recovery periods are associated with higher muscle injury risk in professional men's football.
It sounds like a small wording change. Scientifically, it's a big one.
Performance holds up. That's the trap.
One of the most interesting findings in this area is that congestion doesn't reliably reduce match running.
Julian et al. (2021) pooled the evidence and found no meaningful drop in total distance during congested schedules. Some studies did show less low- and moderate-intensity running, which suggests players may pace themselves to protect their high-intensity efforts.
Dellal et al. (2015) tracked players through six matches in 18 days. Physical and technical performance stayed stable. But the match injury rate was significantly higher during the congested period.
Pinheiro et al. (2023) found a similar pattern. No clear change in physical, physiological or psychophysiological measures between short and long recovery intervals, yet a high rate of muscle injury across the congested block.
That's the key lesson for practitioners: maintained performance doesn't mean complete recovery.
So, as an example, a player can hit their usual distance, their usual high-speed numbers and still look sharp on the ball. None of that means the cost of doing it was zero.
If the dashboard looks normal, it's really tempting to conclude the player is coping. The evidence says be careful.
A simpler way to think about load
This led me to rethink how I describe load.
My first instinct was to split it into categories: physical load, schedule load, travel load, mental load. The more I read, the less comfortable I was with that. It got messy, very quickly!
There's far too much overlap. Travel mostly matters because it eats into recovery. Days between matches are both part of the schedule and the recovery window. Add them all into one score and you count the same problem several times.
The model I now find more useful is much simpler.
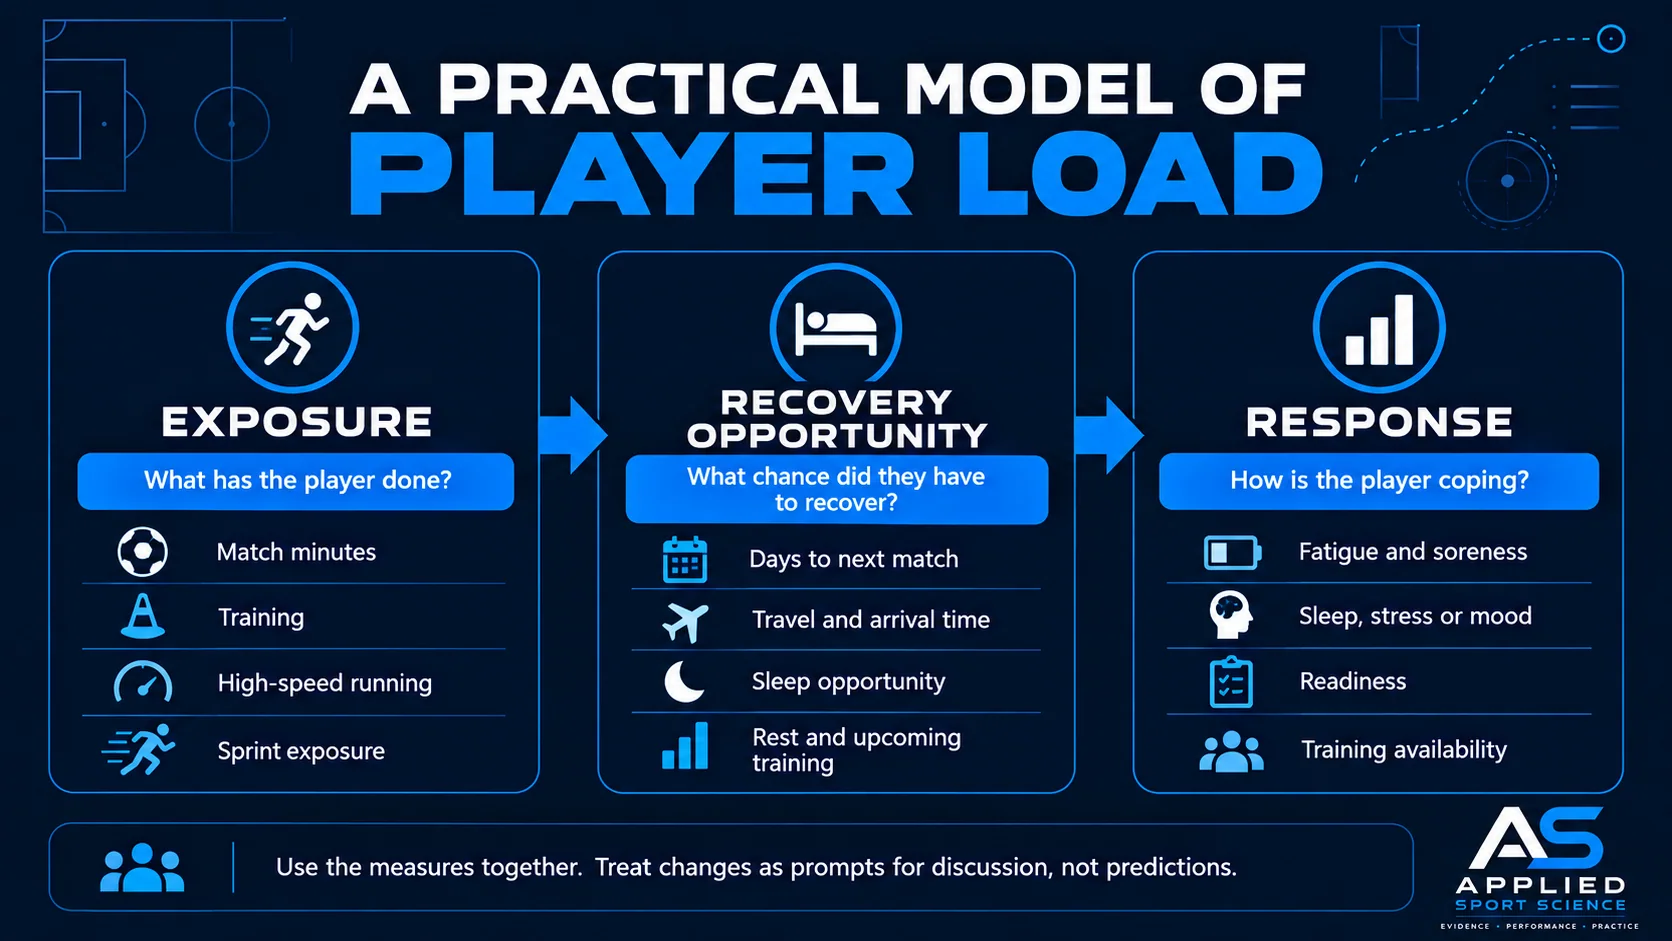
Exposure: what has the player done?
Match minutes, starts, training duration, session RPE, high-speed running, sprint exposure, key mechanical demands, and cumulative minutes over recent weeks.
This is where GPS sits, and sure, it still matters. It's just the first link in the chain.
Recovery opportunity: what chance did they have to recover?
Days until the next fixture, travel duration, arrival time, time zones crossed, realistic sleep opportunity, rest days and upcoming training.
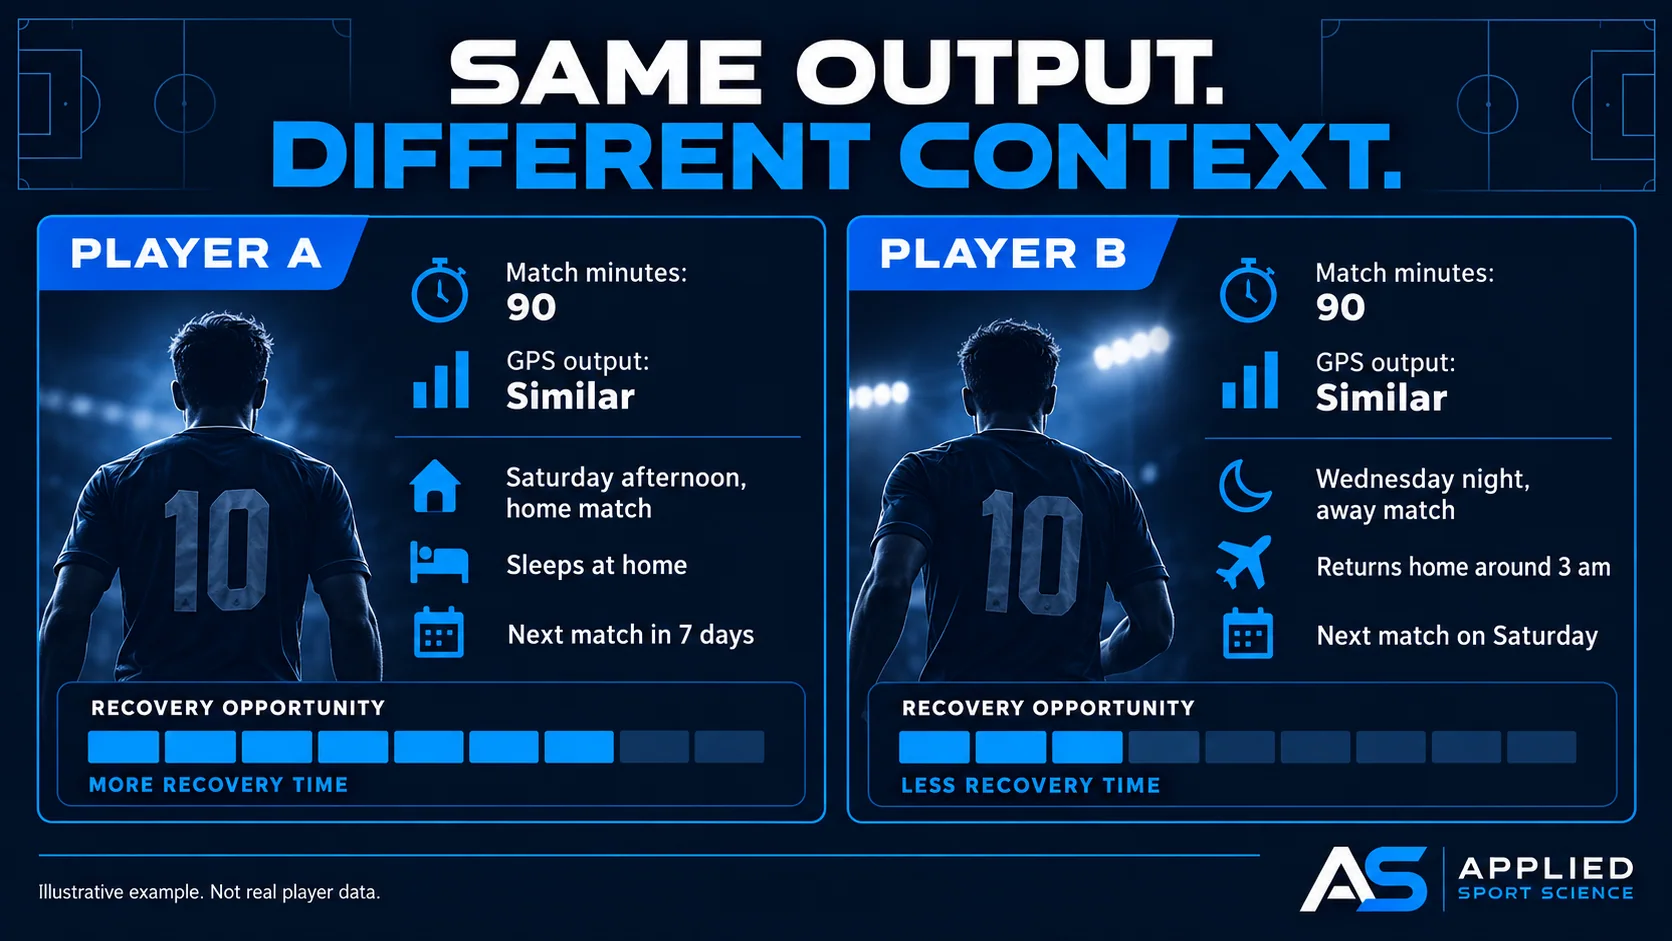
So, take two players who both play 90 minutes with almost identical GPS numbers.
Player A plays at home on Saturday afternoon, sleeps in his own bed and has seven days until the next match.
Player B plays away in Europe on Wednesday night, lands after midnight, gets home around 3am and plays again on Saturday.
Same exposure. Completely different recovery opportunity.
Response: how is the player actually coping?
Fatigue, soreness, sleep, stress and mood, perceived recovery, readiness, neuromuscular measures where appropriate, training availability and medical presentation.
This is where I believe the monitoring earns its keep. The aim isn't to predict the future. It's to spot changes worth a conversation.
Travel and mental fatigue: context, not scores
Travel is a good test of this model.
Travel fatigue and jet lag are both very real. But football evidence that travel independently causes injury, once match exposure and recovery are accounted for, is, well, limited.
Den Hollander et al. (2024) compared 1,270 injuries with 2,540 matched controls across five major European men's leagues. In the 28 days before injury, injured players had more match exposure, less recovery time and more international travel.
That's important. But those factors are tangled together. Was it the flight, the extra match, the lost sleep or the shorter recovery window? We can't yet separate them.
So rather than giving travel a score, I'd rather use it to sharpen the recovery picture. What time did we get home? How much sleep did that realistically allow? When is the next session?
Those questions, for me, are more useful than “travel load = 74”.
Mental fatigue is similar. Studies show it can hurt some technical outcomes. Sun et al. (2022) found more errors and fewer successful tackles, though passing wasn't affected. But a lab protocol isn't the same as a long tactical meeting, selection pressure or a player who can't switch off.
I'd absolutely monitor stress, mood and mental fatigue as part of the player's response. I wouldn't invent a “mental load” score.
Women's football needs its own evidence
Almost all of the congestion research comes from men's professional football.
The women's evidence base is growing. The UEFA Women's Elite Club Injury Study followed 596 players and recorded 1,527 injuries over four seasons (Hallén et al., 2024). That's valuable epidemiology, but it doesn't address congestion directly.
The most direct evidence so far is small. Den Hollander et al. (2024) studied 81 injuries across four European women's leagues and found injured players had more instances of fewer than five days between matches than their matched controls.
That is a signal worth taking seriously, not a basis for copying men's findings wholesale.
Women's football also has a different problem. Some elite players face brutal club and international calendars. Others get very little competitive exposure at all.
So player welfare can't just mean “reduce load”. A better aim is appropriate exposure with enough opportunity to recover. That applies equally to squad players in the men's game who train every week but rarely play.
The trouble with a single number
More data doesn't automatically mean better decisions.
The acute:chronic workload ratio is the clearest example. For years, ACWR thresholds were presented almost as safe and unsafe zones. Stay in the sweet spot. Avoid the spike.
But honestly, the evidence never supported that certainty. The calculation has a built-in statistical flaw known as mathematical coupling (Lolli et al., 2019). Reviews haven't found a reliable injury threshold (Jiang et al., 2022). And when a cluster randomised trial of 482 elite youth footballers managed load using ACWR, it made no difference to health problems (Dalen-Lorentsen et al., 2021).
The same caution applies to composite load scores and injury-prediction dashboards. There's no validated way to combine GPS, minutes, flights, sleep, stress and wellness into one meaningful number. Any weighting is largely guesswork.
And the more sophisticated the number looks, the easier it is to forget how uncertain it is.
What I'd actually monitor
Keep it simple. For most elite environments:
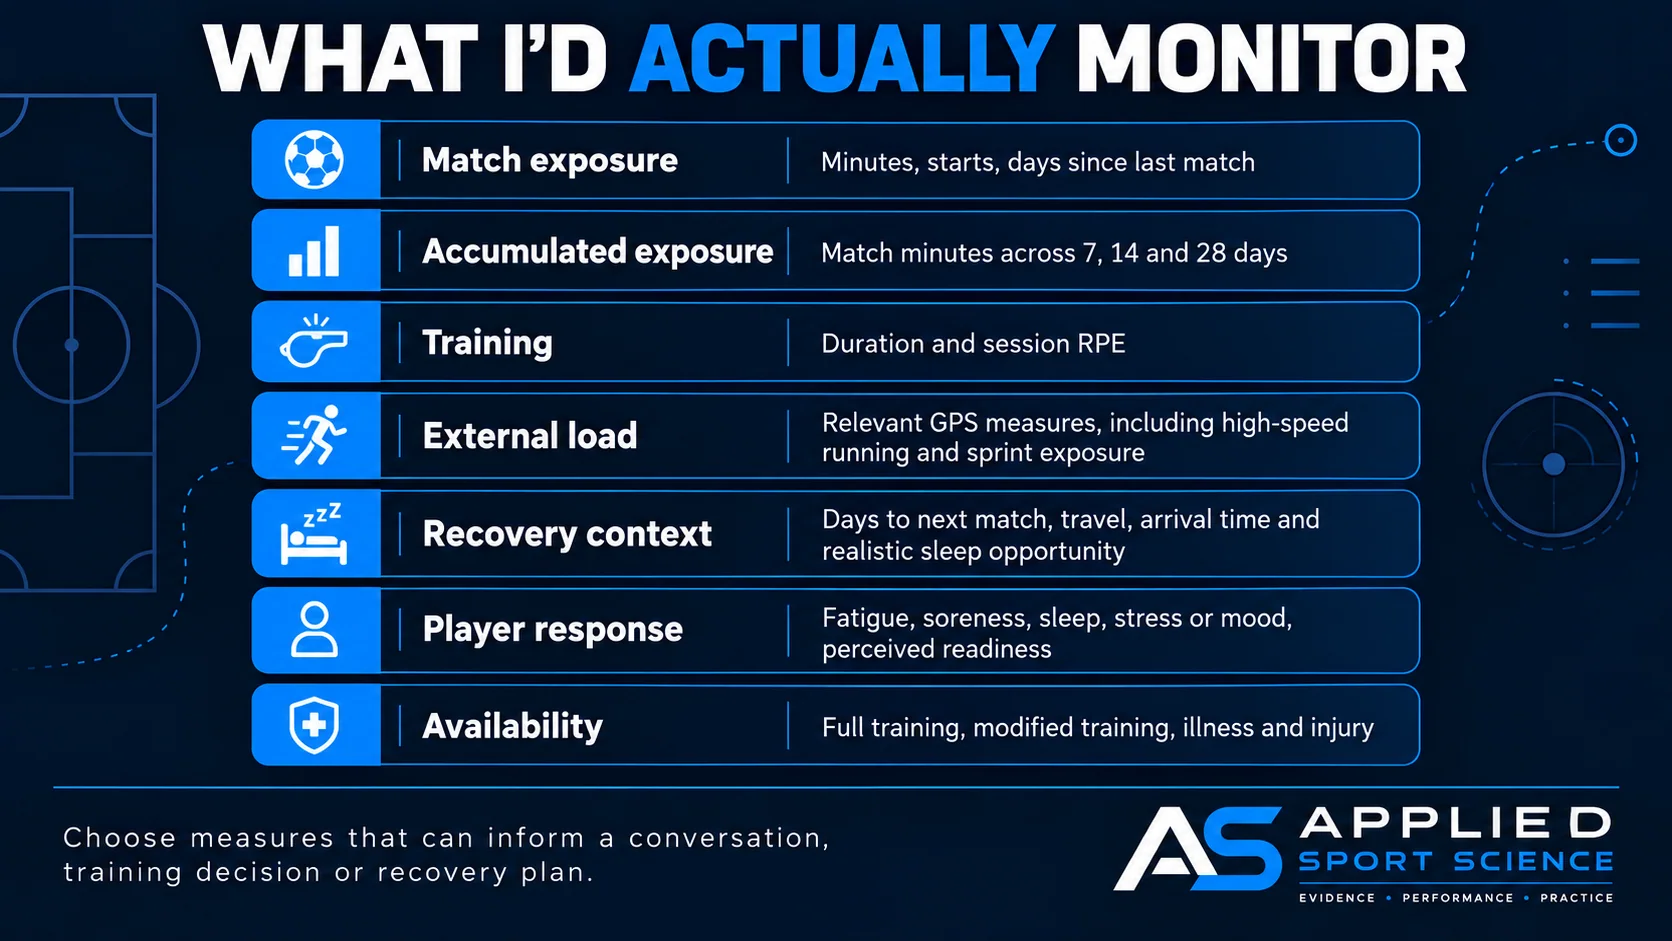
- Match exposure: minutes, starts and days since the last match
- Accumulated exposure: rolling match minutes over 7, 14 and 28 days
- Training: duration and session RPE
- External load: a small number of relevant GPS variables, including high-speed and sprint exposure
- Recovery context: days to the next match, travel and arrival times, realistic sleep opportunity
- Player response: fatigue, soreness, sleep, stress or mood, and readiness
- Availability: full training, modified training, illness and injury
A jump test or other neuromuscular measure can add value where you have the staff, kit and consistency to do it properly.
But I firmly believe that every measure should answer a question. If a metric can't realistically change a conversation, a training decision or a recovery plan, why are you collecting it?
The takeaway
I don't think we need another load number.
We need to look at the player as a system. What did they do? What chance did we give them to recover? How are they coping?
That doesn't replace practitioner judgement. It makes it better informed. And that's what good monitoring should do.
Player load isn't one number. It's the interaction between what a player is exposed to, the opportunity they have to recover, and how they respond.
References
- Bengtsson, H., Ekstrand, J. & Hägglund, M. (2013). Muscle injury rates in professional football increase with fixture congestion: an 11-year follow-up of the UEFA Champions League injury study. British Journal of Sports Medicine, 47(12), 743–747. View paper ↗
- Bengtsson, H., Ekstrand, J., Waldén, M. & Hägglund, M. (2018). Muscle injury rate in professional football is higher in matches played within 5 days since the previous match: a 14-year prospective study with more than 130 000 match observations. British Journal of Sports Medicine, 52(17), 1116–1122. View paper ↗
- Dalen-Lorentsen, T., Bjørneboe, J., Clarsen, B. et al. (2021). Does load management using the acute:chronic workload ratio prevent health problems? A cluster randomised trial of 482 elite youth footballers of both sexes. British Journal of Sports Medicine, 55(2), 108–114. View paper ↗
- Dellal, A., Lago-Peñas, C., Rey, E. et al. (2015). The effects of a congested fixture period on physical performance, technical activity and injury rate during matches in a professional soccer team. British Journal of Sports Medicine, 49(6), 390–394. View paper ↗
- den Hollander, S., Culvin, A., Kerkhoffs, G. & Gouttebarge, V. (2024). Match workload and international travel associated with (ACL) injuries in professional women's football. European Journal of Sport Science, 24(10), 1423–1431. View paper ↗
- den Hollander, S., Kerkhoffs, G. & Gouttebarge, V. (2024). The impact of match workload and international travel on injuries in professional men's football. Sports, 12(8), 212. View paper ↗
- Hader, K., Rumpf, M. C., Hertzog, M. et al. (2019). Monitoring the athlete match response: can external load variables predict post-match acute and residual fatigue in soccer? A systematic review with meta-analysis. Sports Medicine – Open, 5, 48. View paper ↗
- Hallén, A., Tomás, R., Ekstrand, J. et al. (2024). UEFA Women's Elite Club Injury Study: a prospective study on 1527 injuries over four consecutive seasons 2018/2019 to 2021/2022 reveals thigh muscle injuries to be most common and ACL injuries most burdensome. British Journal of Sports Medicine, 58(3), 128–135. View paper ↗
- Jiang, Z., Hao, Y., Jin, N. & Li, Y. (2022). A systematic review of the relationship between workload and injury risk of professional male soccer players. International Journal of Environmental Research and Public Health, 19(20), 13237. View paper ↗
- Julian, R., Page, R. M. & Harper, L. D. (2021). The effect of fixture congestion on performance during professional male soccer match-play: a systematic critical review with meta-analysis. Sports Medicine, 51(2), 255–273. View paper ↗
- Kupperman, N. & Hertel, J. (2020). Global positioning system-derived workload metrics and injury risk in team-based field sports: a systematic review. Journal of Athletic Training, 55(9), 931–943. View paper ↗
- Lolli, L., Batterham, A. M., Hawkins, R. et al. (2019). Mathematical coupling causes spurious correlation within the conventional acute-to-chronic workload ratio calculations. British Journal of Sports Medicine, 53(15), 921–922. View paper ↗
- Page, R. M., Field, A., Langley, B. et al. (2023). The effects of fixture congestion on injury in professional male soccer: a systematic review. Sports Medicine, 53(3), 667–685. View paper ↗
- Pinheiro, G. S., Quintão, R. C., Claudino, J. G. et al. (2023). High rate of muscle injury despite no changes in physical, physiological and psychophysiological parameters in a professional football team during a long-congested fixture period. Research in Sports Medicine, 31(6), 744–755. View paper ↗
- Sun, H., Soh, K. G., Mohammadi, A. et al. (2022). Effects of mental fatigue on technical performance in soccer players: a systematic review with a meta-analysis. Frontiers in Public Health, 10, 922630. View paper ↗
- UEFA (2025). UEFA announces launch of groundbreaking joint study on player load. View announcement ↗